Markets move in Cycles anyone that is familiar with The Great Trader Larry Williams you will know what I am Talking about.
In Term of the USA 🇺🇸 during the 4 years of a Presidency the year leading up to the election is usually Bullish for th markets during the first year of a New President markets are also bullish as the optimism of Change in the form of Radical Change gets the public excited.
But 2 years into the Presidency this optimism tends to fade as people realise the flaws in misplaced hope in politicians as Some Leaders can’t deliver on what they promised and politics tends to be a Quagmire and Messy.
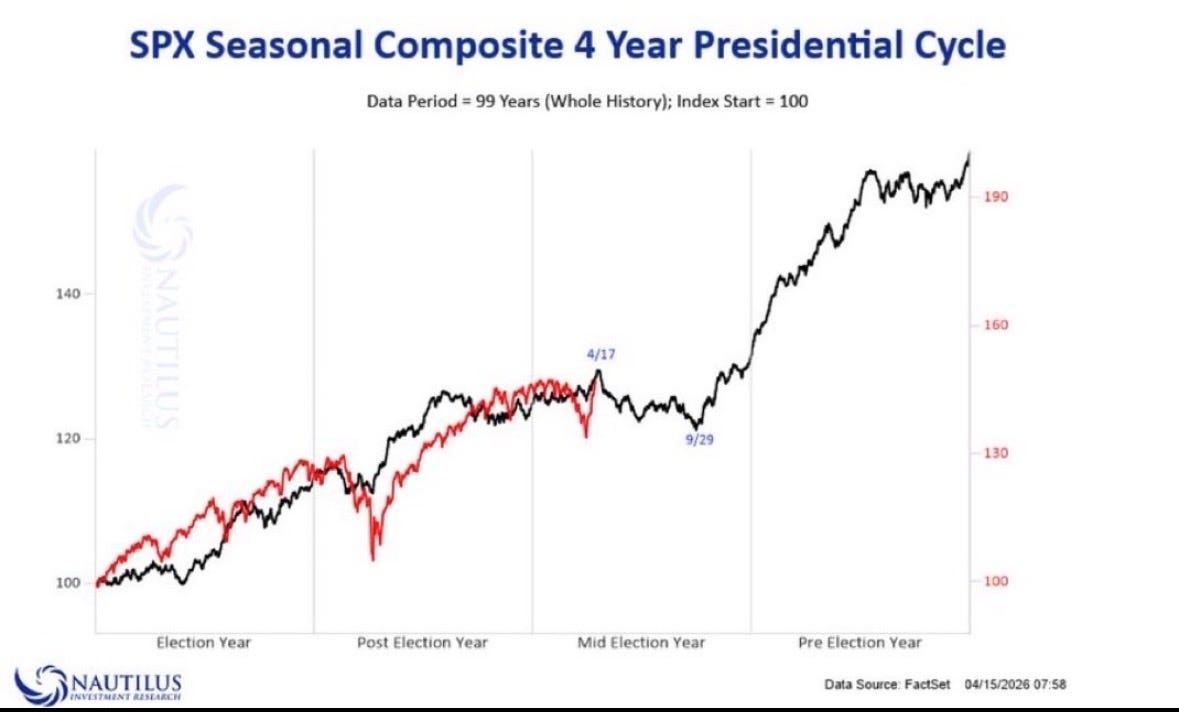
The 4 Year cycle of a New US 🇺🇸 President including the Year before known as the Election Year:
Usually the second Year of a Presidency based on historical data tends to be most messy in Markets and real life. Due to many things but usually due to the midterm there is no rest for a new president as they can lose power from the first Election and the second year is a test of their achievements so far of lack thereoff.
In terms of the market the second year of a presidency tends to be most bearish but to begin with an ends the year where we started before the drop.
There is also something that happens a catalyst this tends to be some sort of disaster domestically or internationally.
No clues about what is happening now in the Trump presidency. This Iran war and a coming disaster I have mentioned in the previous chart.
To give an example of Second Year drama remember Biden in 2022 the Ukraine 🇺🇦 War. The war started during his second year in office. By accident ? who knows I like to not deal in accidents but in probabilities and surprise surprise we in another war this time The USA 🇺🇸 and Israel 🇮🇱 are the aggressors for what ever reason they gave.
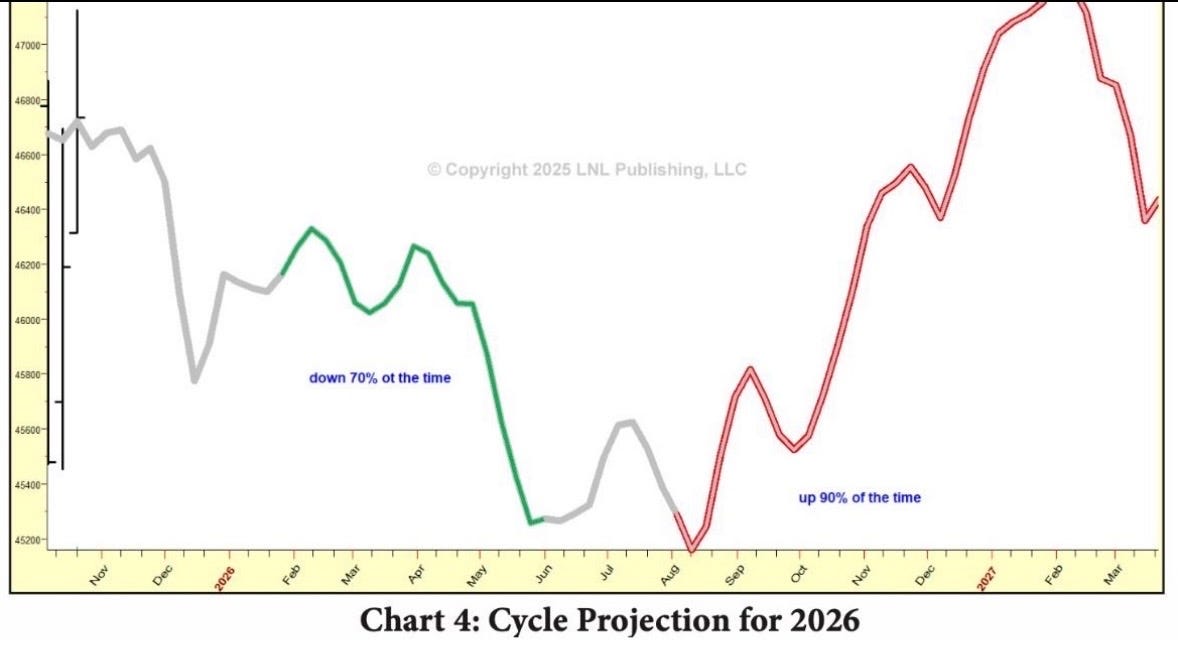
Politics aside to go into detail this second year what usually happens is that markets make a new high in April but in May they tend to go down. In the past the drop can happen in February or March but there is a secondary drop that is worse than the first drop.
See Larry Williams example from his 2026 outlook.
Now usually When I look at things like this I tend to ask myself what would be the catalyst for such a dramatic drop usually it’s something big. I have highlighted th key catalyst in the previous article.
Now if such a drop would occur it would be one of the biggest sells ever and also one of the biggest buying opportunities ever. It would not be enough to simply take the sell but also take the buy.
Key Dates to keep an eye out for this drop to truly unfold.
1. FOMC April 29th
2.May 15th the End of Powells Term
This was a short write up. Good Luck everyone will Update you on this situation as it happens.

Thanks as always Yusuf.